Interactive Data Science and Visualization
Explore the design and construction of world-class data visualizations and interactive data science experiences.


This couse is open source and creative commons. It is offered continually without a fixed schedule. You can complete it at your own pace and you are welcome to collaborate with others. You are encouraged to share your work!
About the course
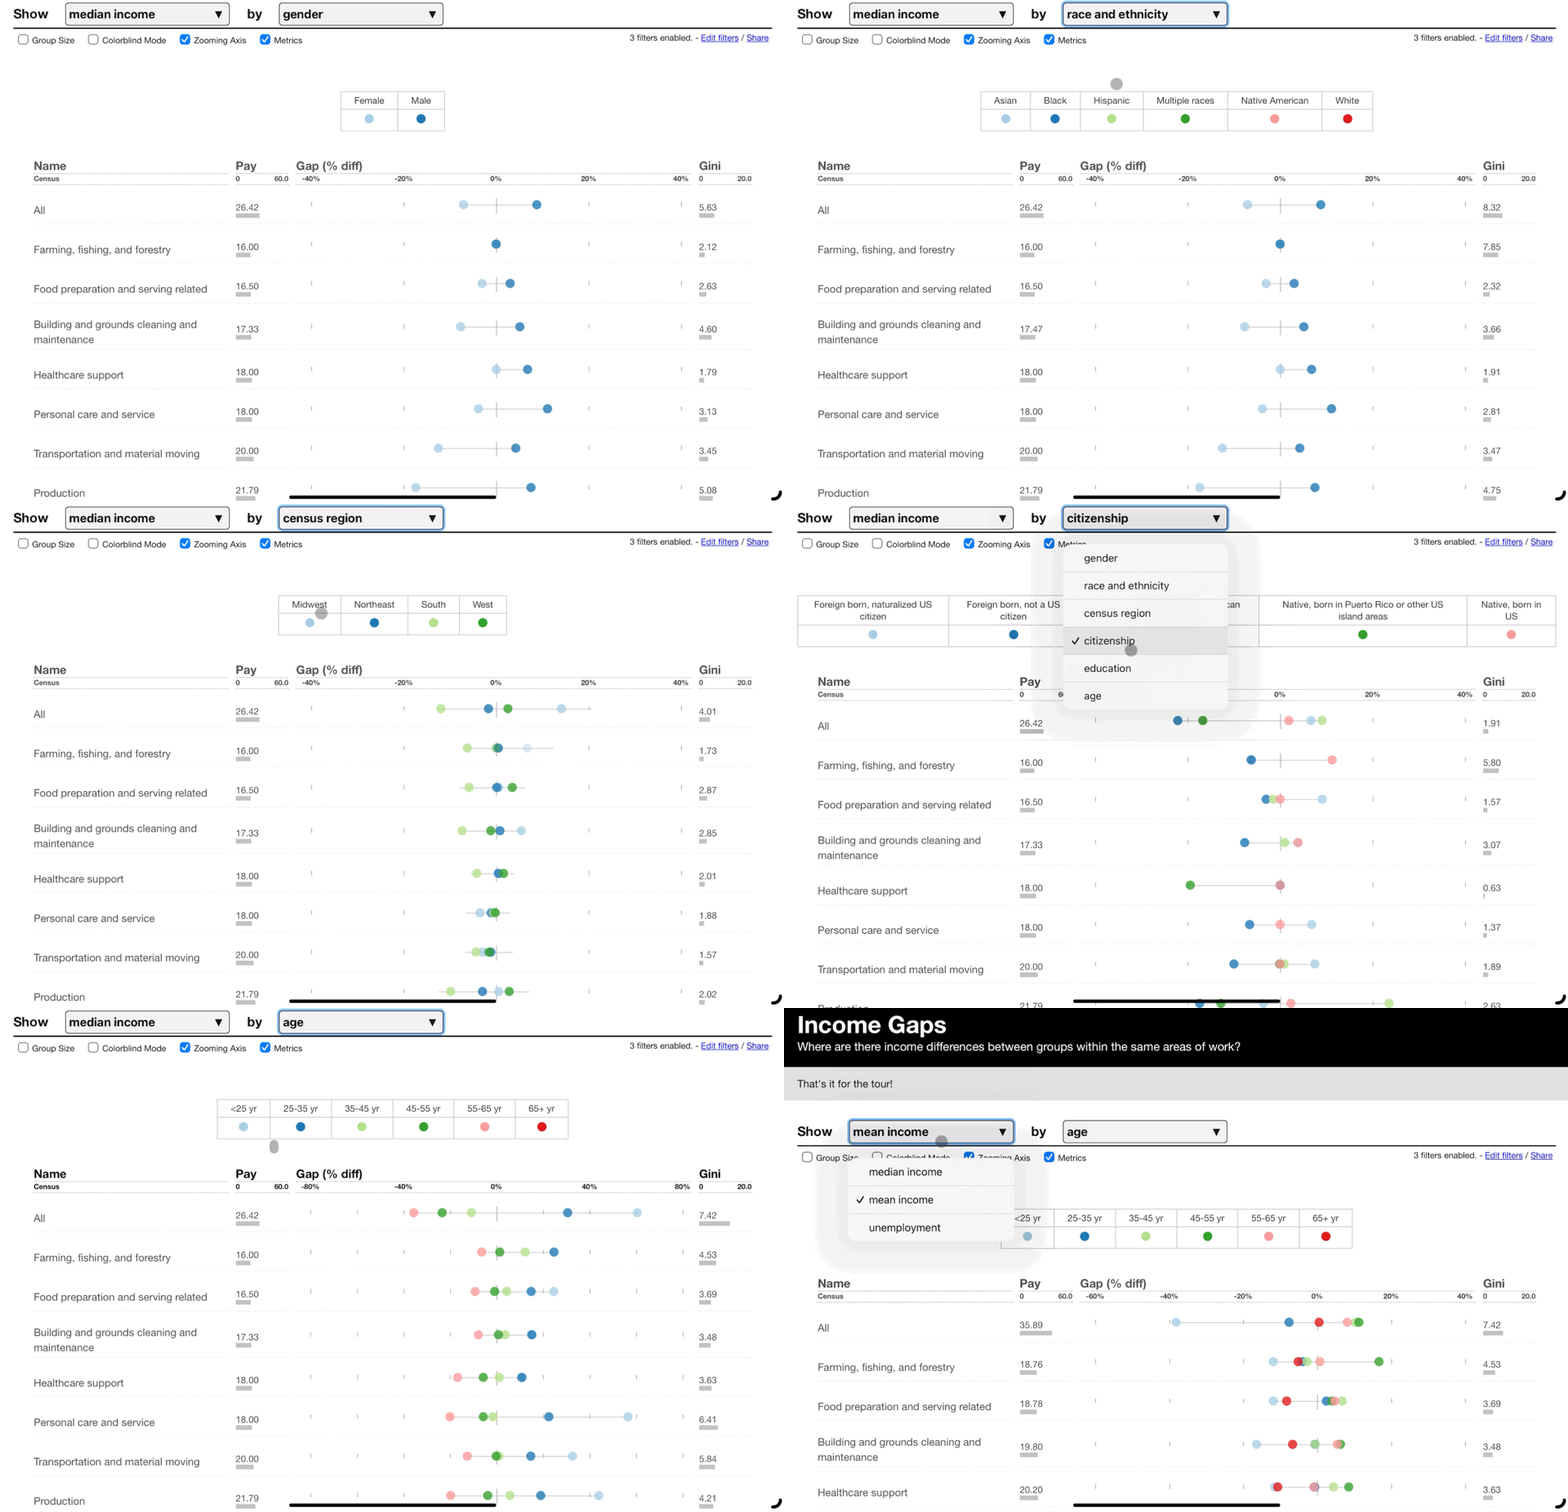
Data and computation are essential to how we understand the world. This means that a bar chart is more than just a graphic. The way we interact with digital tools, analyses, and simulations all change the insights we learn, the stories we tell, the actions we take, who is included, and what is left out.
All digital tools matter but the design of interfaces which convey information and support dialogue with data and artificial intelligence are particularly powerful. This free Massive Open Online Course emphasizes critical analysis as well as the practical design / technical skills needed to make these word-class information design experiences which bring users into interaction with these powerful forces. Together, we will explore how we may intentionally and ethically build these data-intensive tools that shape humanity's relationship with the digital world.
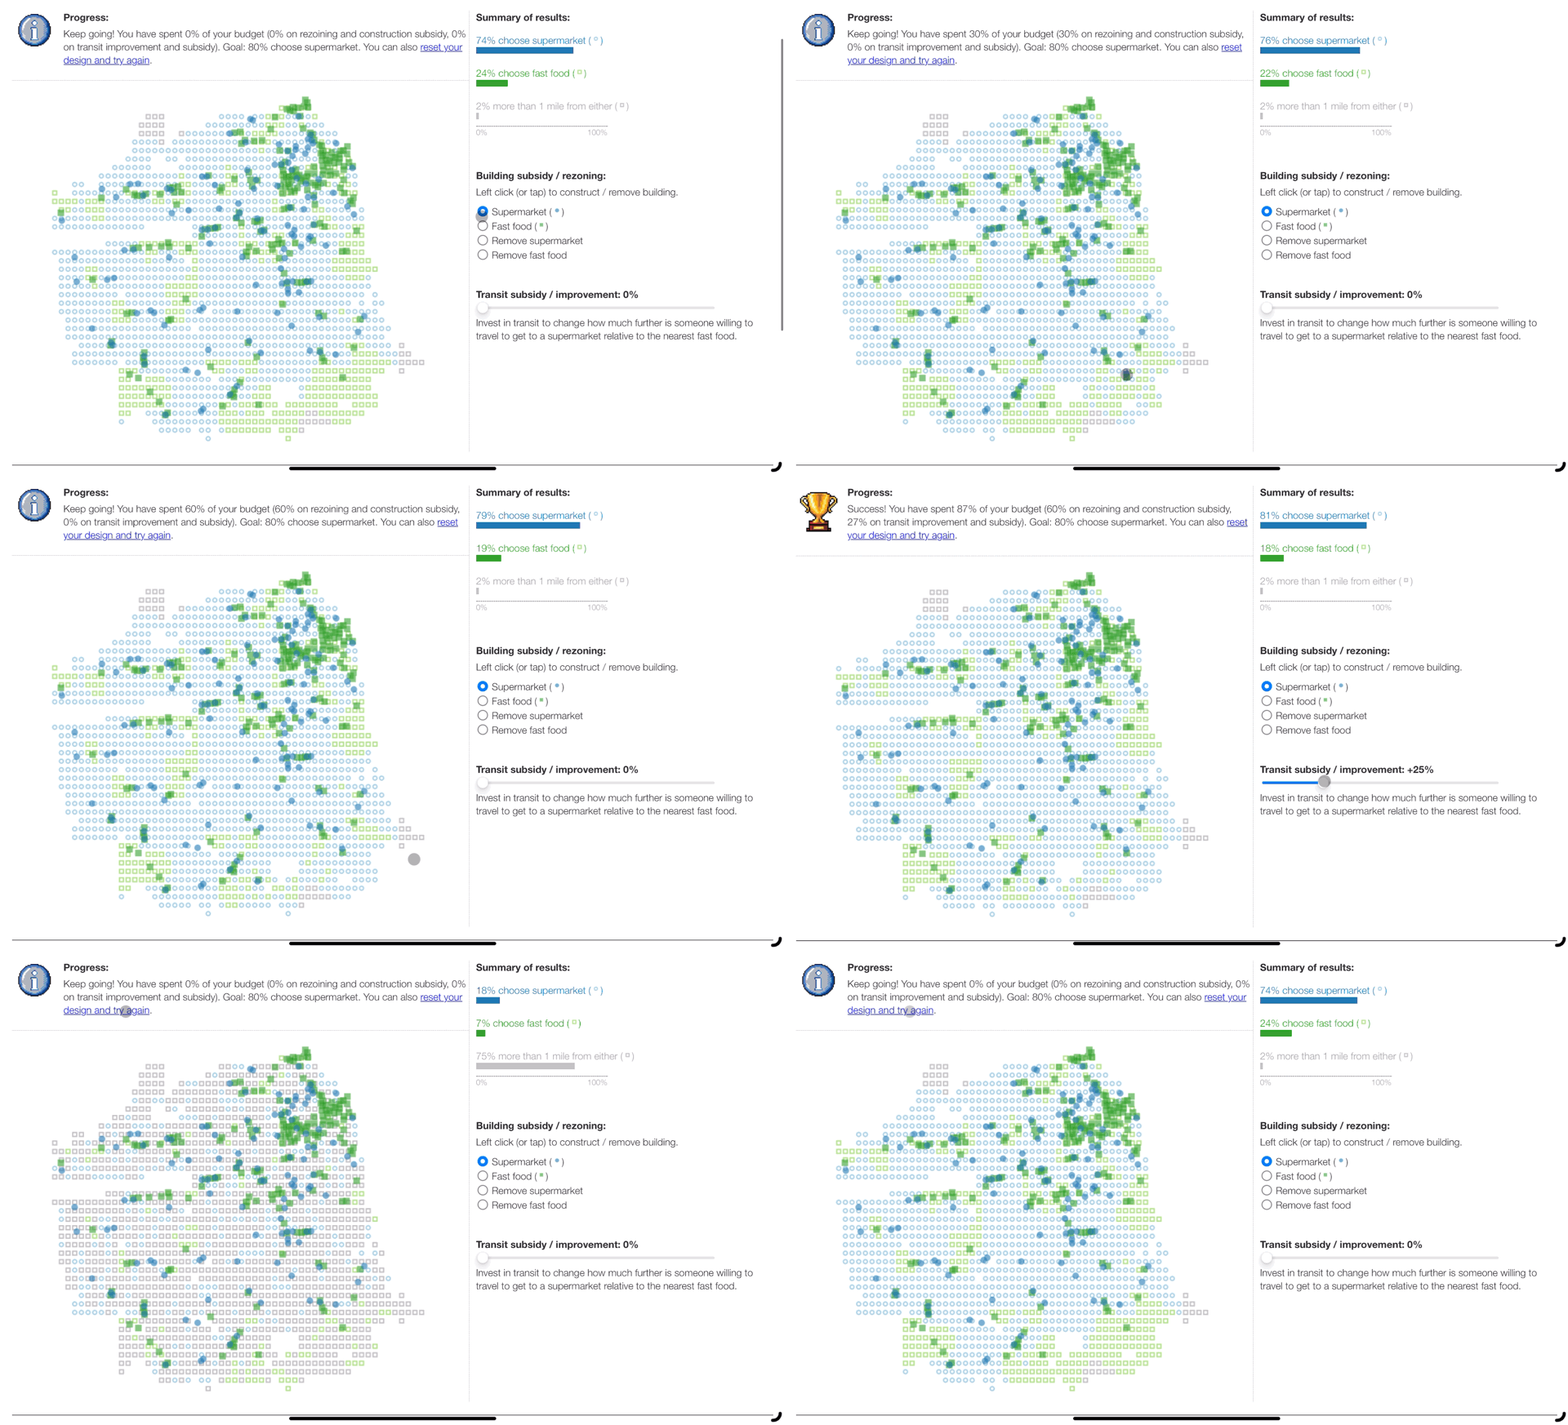
This hands-on class explores the building of human-centered data intensive tools. This course includes the fundamentals of data visualization. However, it also augments that traditional coursework with modern interaction and game design concepts, considering how to build for a world with increasingly complex data and novel AI / ML systems. By completing this material, learners will be able to build sophisticated data visualizations, engaging decision support tools, and cutting-edge simulation interfaces for intelligent systems.
These course materials are open source and free to anyone.
FAQ
The following are the frequently asked questions for the online version of this course.
What does this course cost?
The online version of this course is free to the public and provided continually. No tution needed! However, if you are part of the University of California community, this class may be avalable for credit in the in-person version.
Who is the course for?
Though originally built with scientists and engineers in mind, this course is also applicable to designers, artists, and journalists with some experience or interest in programming. This class aims to be valuable to anyone who wants to blend code and design to explore new methods for interactively and visually understanding, experiencing, and communicating data, science, and systems.
What will we do together?
- Explore foundational theory and fundamentals related to data visualization before studying cutting edge work in interactivity for data and science.
- Learn practical career-building technologies for building both static and interactive data experiences through hands-on portfolio-building activities.
- Critically examine existing powerful and informative interactive experiences including data visualizations and other interactive media like video games.
What will you be able to do after?
- Build data visualizations and other interactive experiences to share your data findings with others.
- Invite your audience in as co-creators to build new meaning alongside you in your work.
- Craft digital tools which help both you and your users navigate data-heavy tasks and uncover insights.
- Tell impactful stories that engage your readers emotionally through data.
- Incorporate ethics and accessibility into your work.
- Critically interrogate data visualizations as a reader.
- Design interactive interfaces for intelligent systems.
Are there prerequisites?
There are no explicit skills that you need to have piror to starting this course. That said, except for optional lectures at the very end, instruction is in Python.
This course will be accessible to those with at least introductory programming experience in almost any language including C/C++, Python, Java, JavaScript, etc. That in mind, the following libraries could work within this class though prior familiarity with these libraries is absolutely not required:
- Instruction is provided in Python and materials teach participants how to use Sketchingpy.
- If you have familiarity with Java, Processing will work just fine.
- Similarly, D3 or P5 will work great as well for those who know JavaScript.
Though there are materials available to help if this is your first time programming, students will be most successful if they have already had some prior programming experience.
Is there a schedule, credit, or certificate?
You are welcome to go through this material at your own pace. You are also encouraged to share your work with others online! However, there is no official credit or certificate given for completion.
Do I need to purchase any special software or computers?
This is continually available. No special software needed. You can do it all from your browser (if you prefer). Get started today and go at your own pace.
Does this differ from the in-person version at UC Berkeley?
I have posted my rehearsal recordings, not recordings of the actual lectures. In some cases, the actual lecture was modified after rehearsal. These changes may or may documented in some lessons as needed for successful MOOC learning.
Additionally, some exercises have been modified to be successful where you do not necessarily have classmates available for live conversations. This means that you can complete the course at your own pace. You may also choose to do this corse with others or on your own.
Finally, the MOOC does not offer credit or certification for completion.
There are also a few documents to highlight before diving into lectures, exercises, and labs. These may be useful across the entire course.
Credits
This course was designed and taught by A Samuel Pottinger. It was originally taught in Spring 2025 at UC Berkeley as Stat 198. This massive online open course (MOOC) is not affiliated with the University. Open source and creative commons.
The course recieved resources from the Schmidt Center for Data Science and Environment and the Fung Institute for Engineering Leadership. We thank these organizations!
Lessons
The course is broken into five sections followed by a hello, primitives, combination, conversation, and context. It is recommended that you go in order as material from one lesson helps set up the concepts introduced in the subsequent lessons.
Section 1: Hello
We start our journey together by motivating why data visualization is useful, what interactive science can offer, and take an early look at some of the foundational ideas that we will explore together throughout the rest of the course. We will also make sure everyone has what they need to do some upcoming activities with two skills labs.
Section 2: Primitives
We next transition to the foundational building blocks of data visualization and explore the cognitive science underpinnings behind effective information design. We also have our first small projects that begin to offer hands-on experiences to build custom graphics with code.
Section 3: Combination
Having built up the primitives used in data visualization, we pick up the pace to build sophisticated data graphics. After using existing chart types, we venture into the great unknown by looking at how these building blocks enable us to build completely new visual representations and how to test if novel approaches are successful.
Section 4: Conversation
Just short of half way through the course, you are already an expert at choosing from existing chart types and constructing your own novel visual representations. Next we look critically at the role of the reader to construct media which enable users to explore more freely and become a co-creator of knowledge.
Section 5: Context
Now that we have a deeper understanding of how to think about the reader within our designs, we next zoom out to understand users as within a broader social and physical context. We also consider visualization in a broader sense-making context.
Conclusion
You now have some of the most important concepts in data visualization and interactive science. Next, we explore different technical skills and complete a final project.